Have a deep look at your business processes.
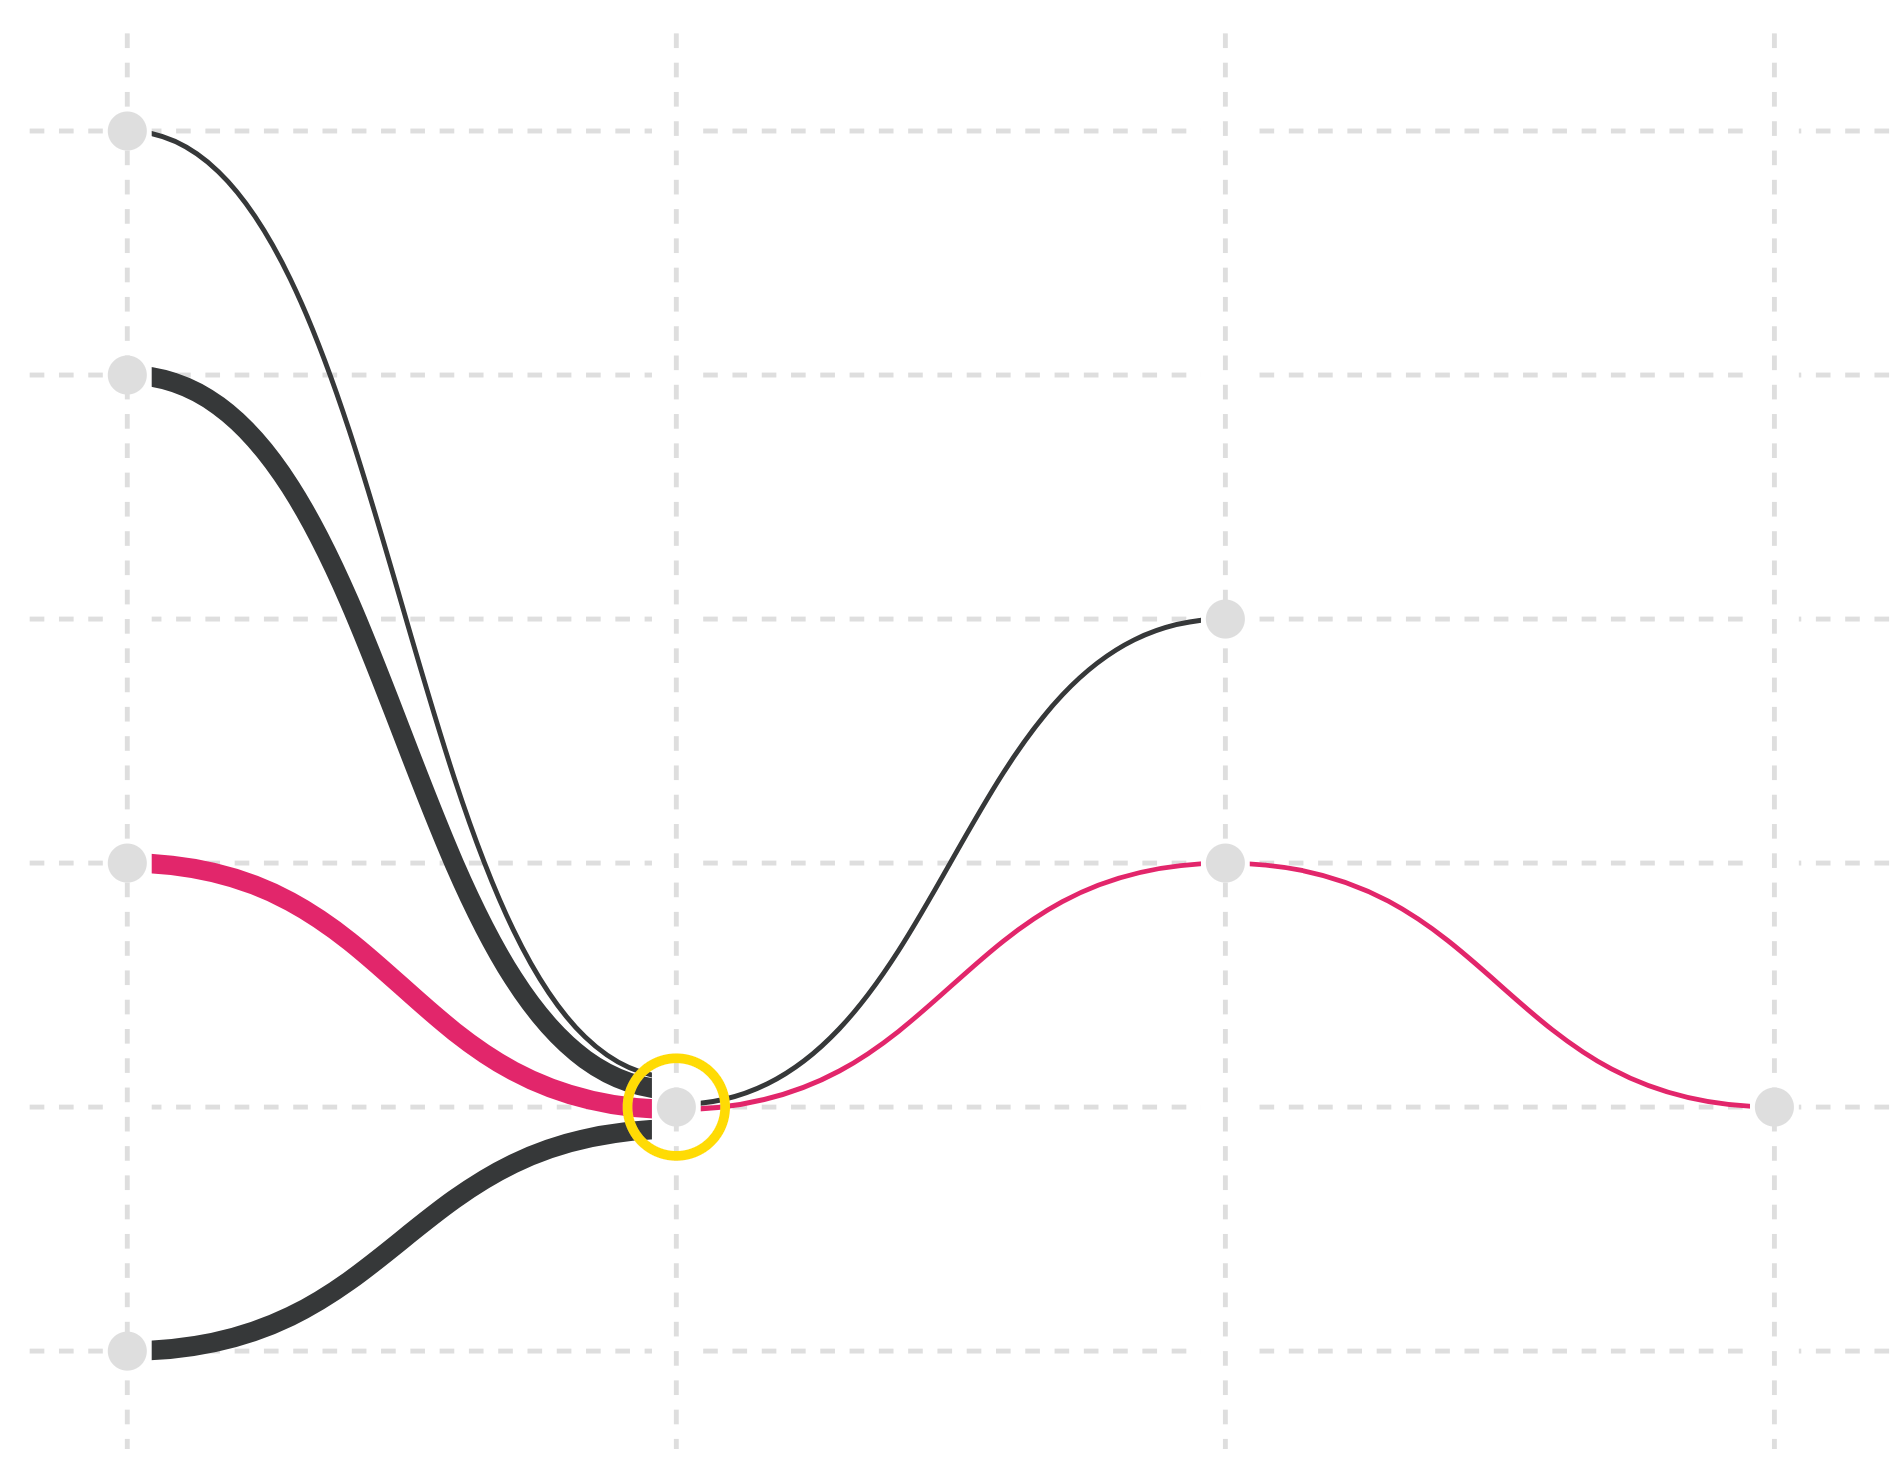
Qbert provides a versatile user interface with a focus on data visualization and collaborative functions. The highly interactive dashboard facilitates the visual exploration of process information and the discovery of process anomalies.
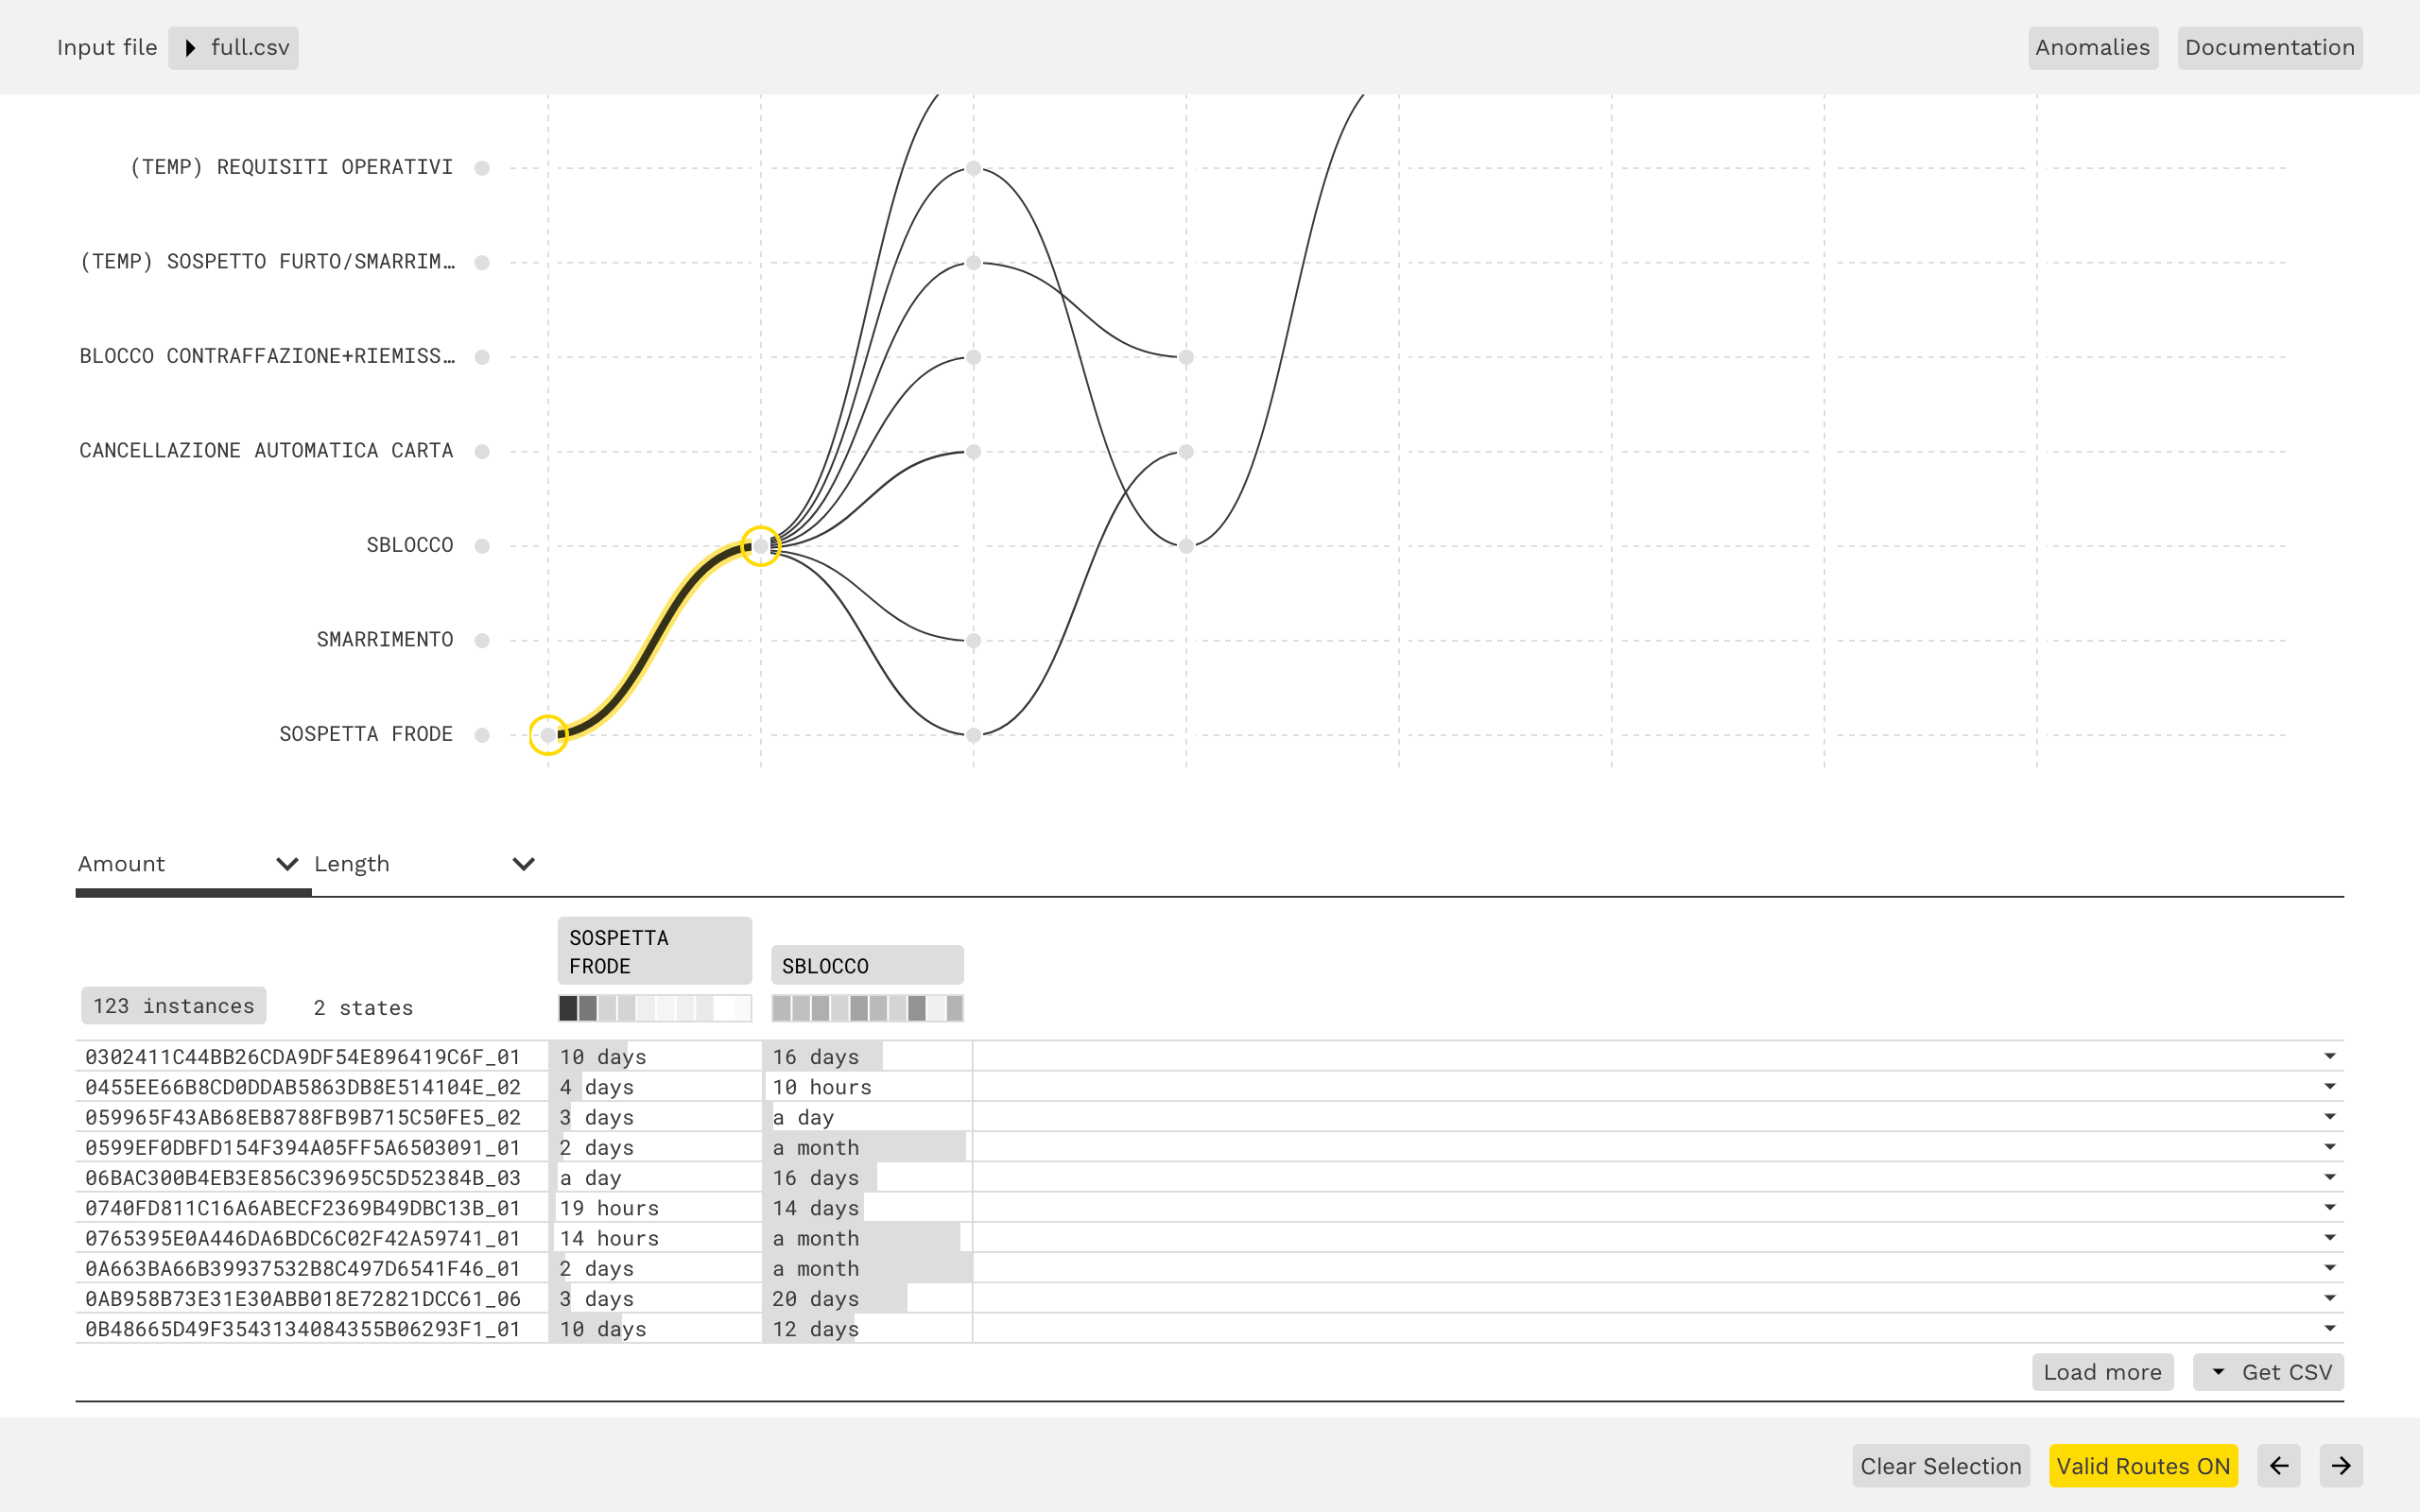
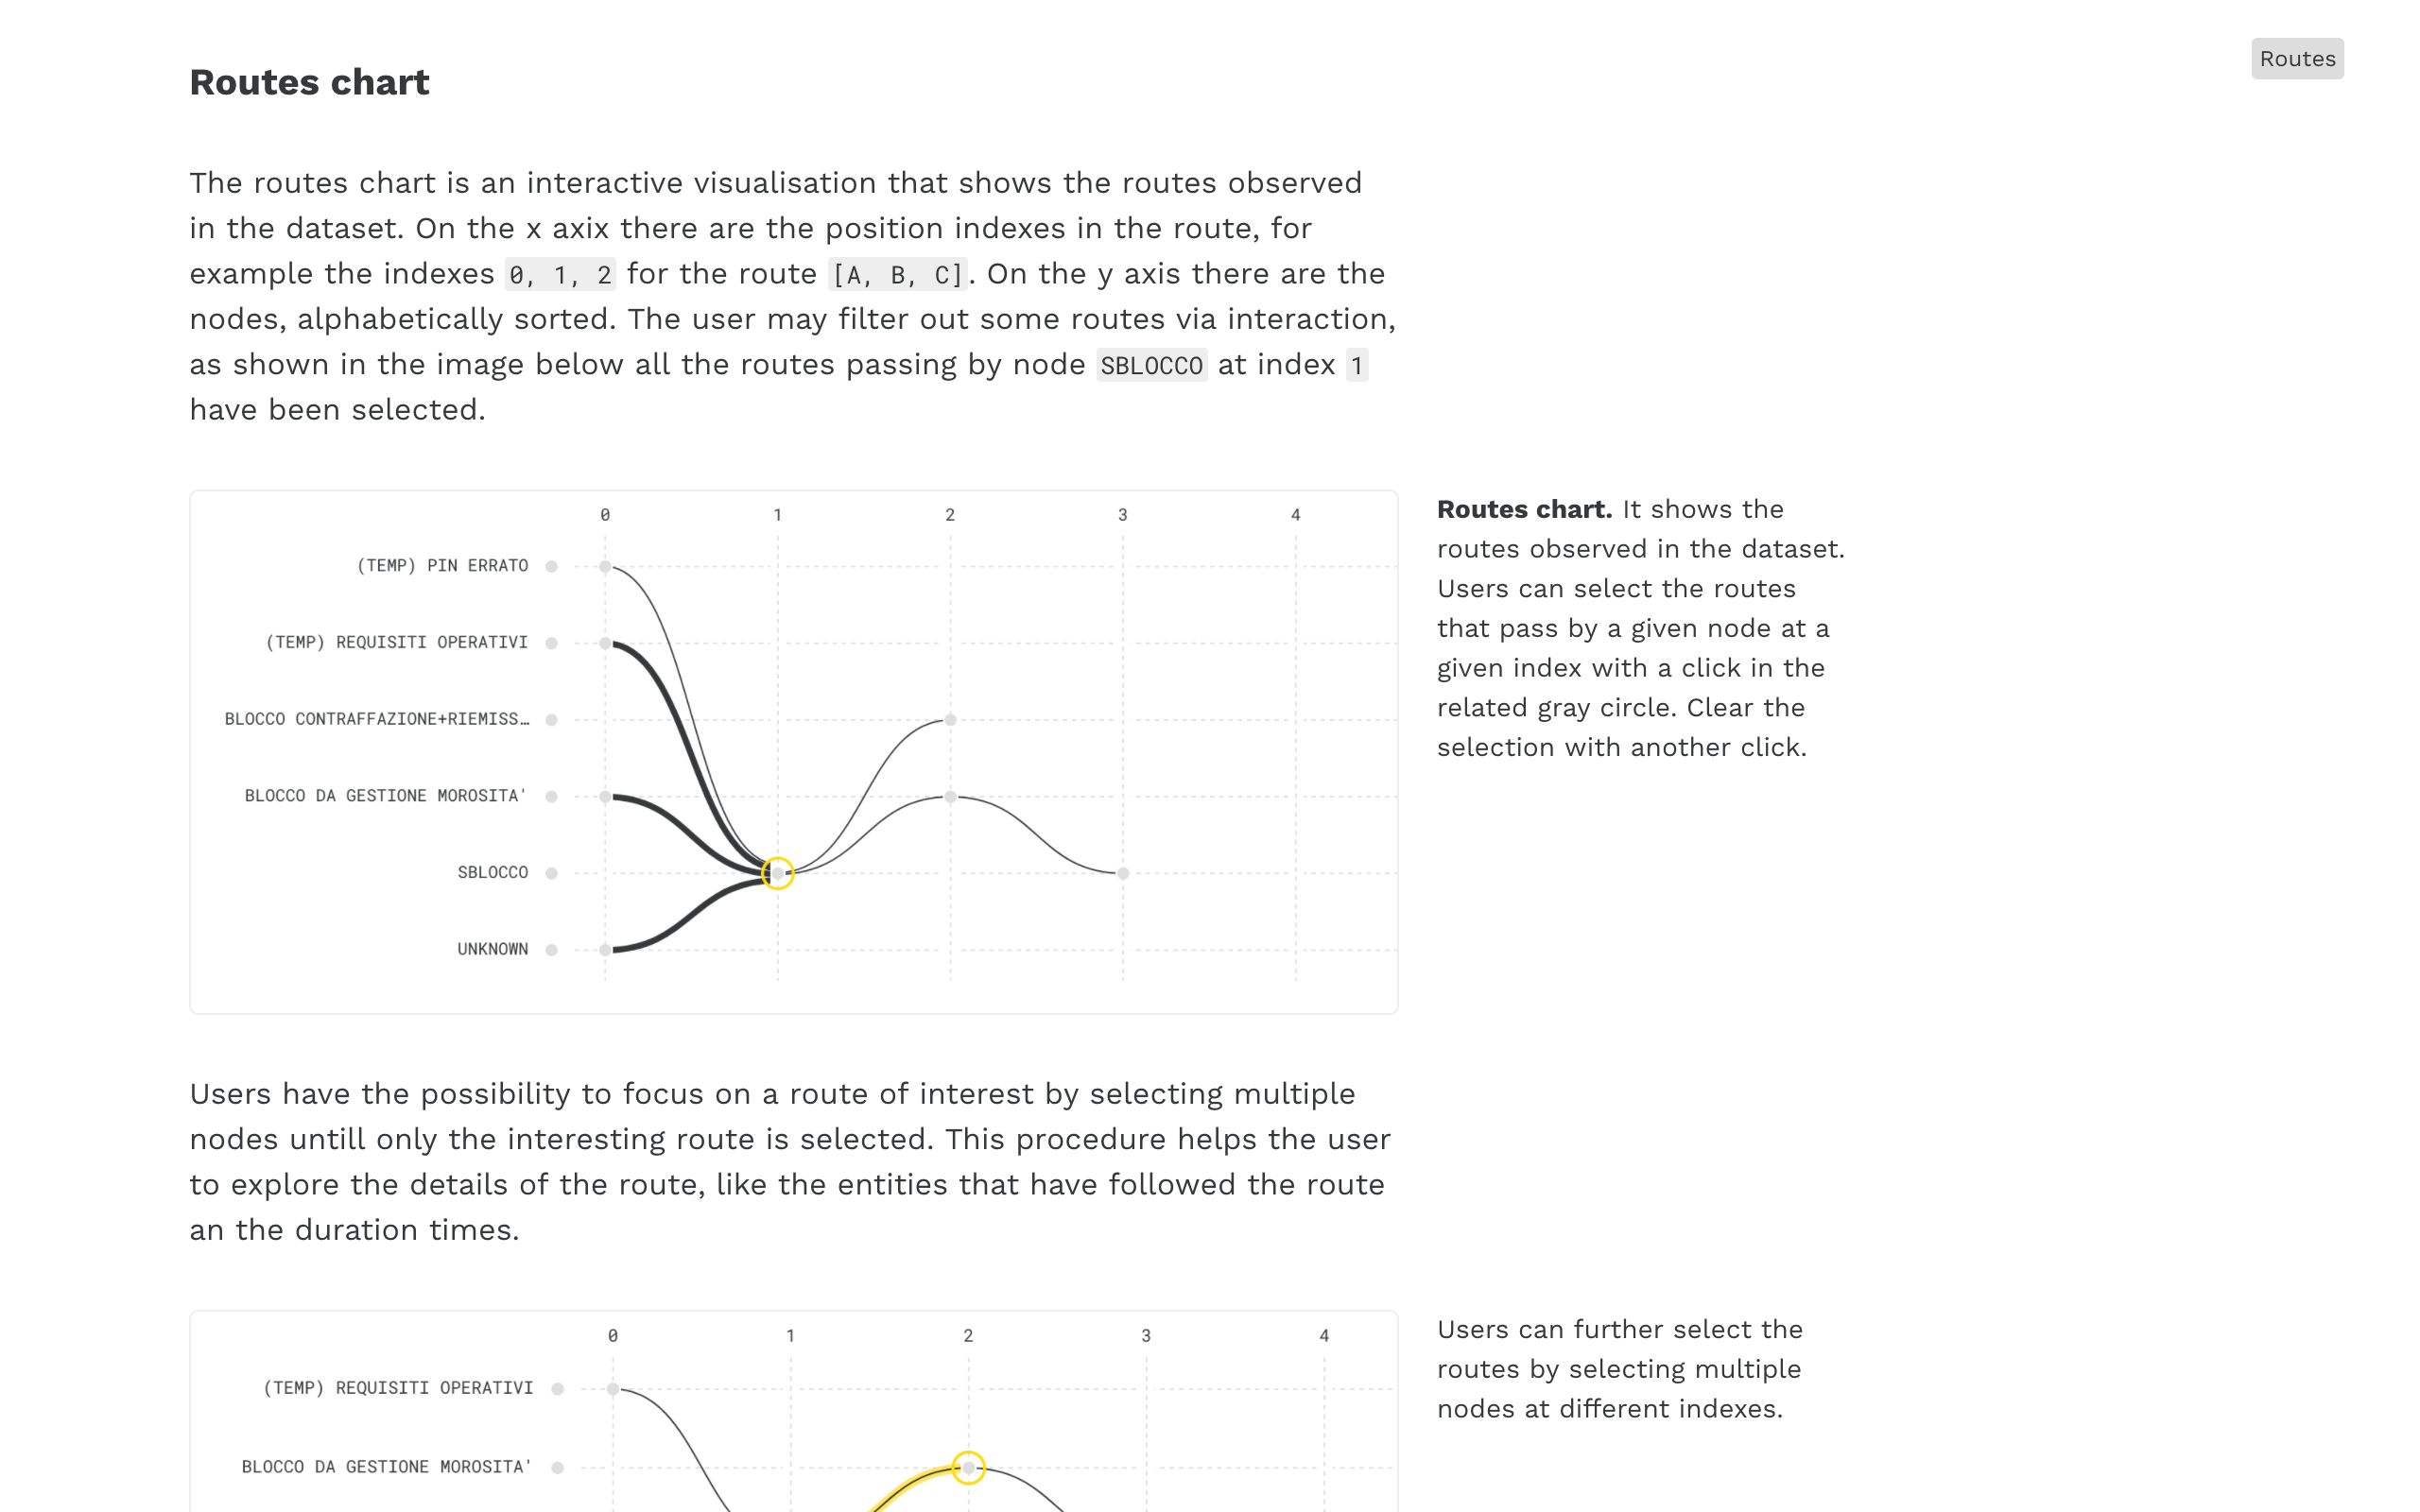
Analyze the process routes by interacting directly with their visual representation, explore duration times and get the details of all entities involved in the process.
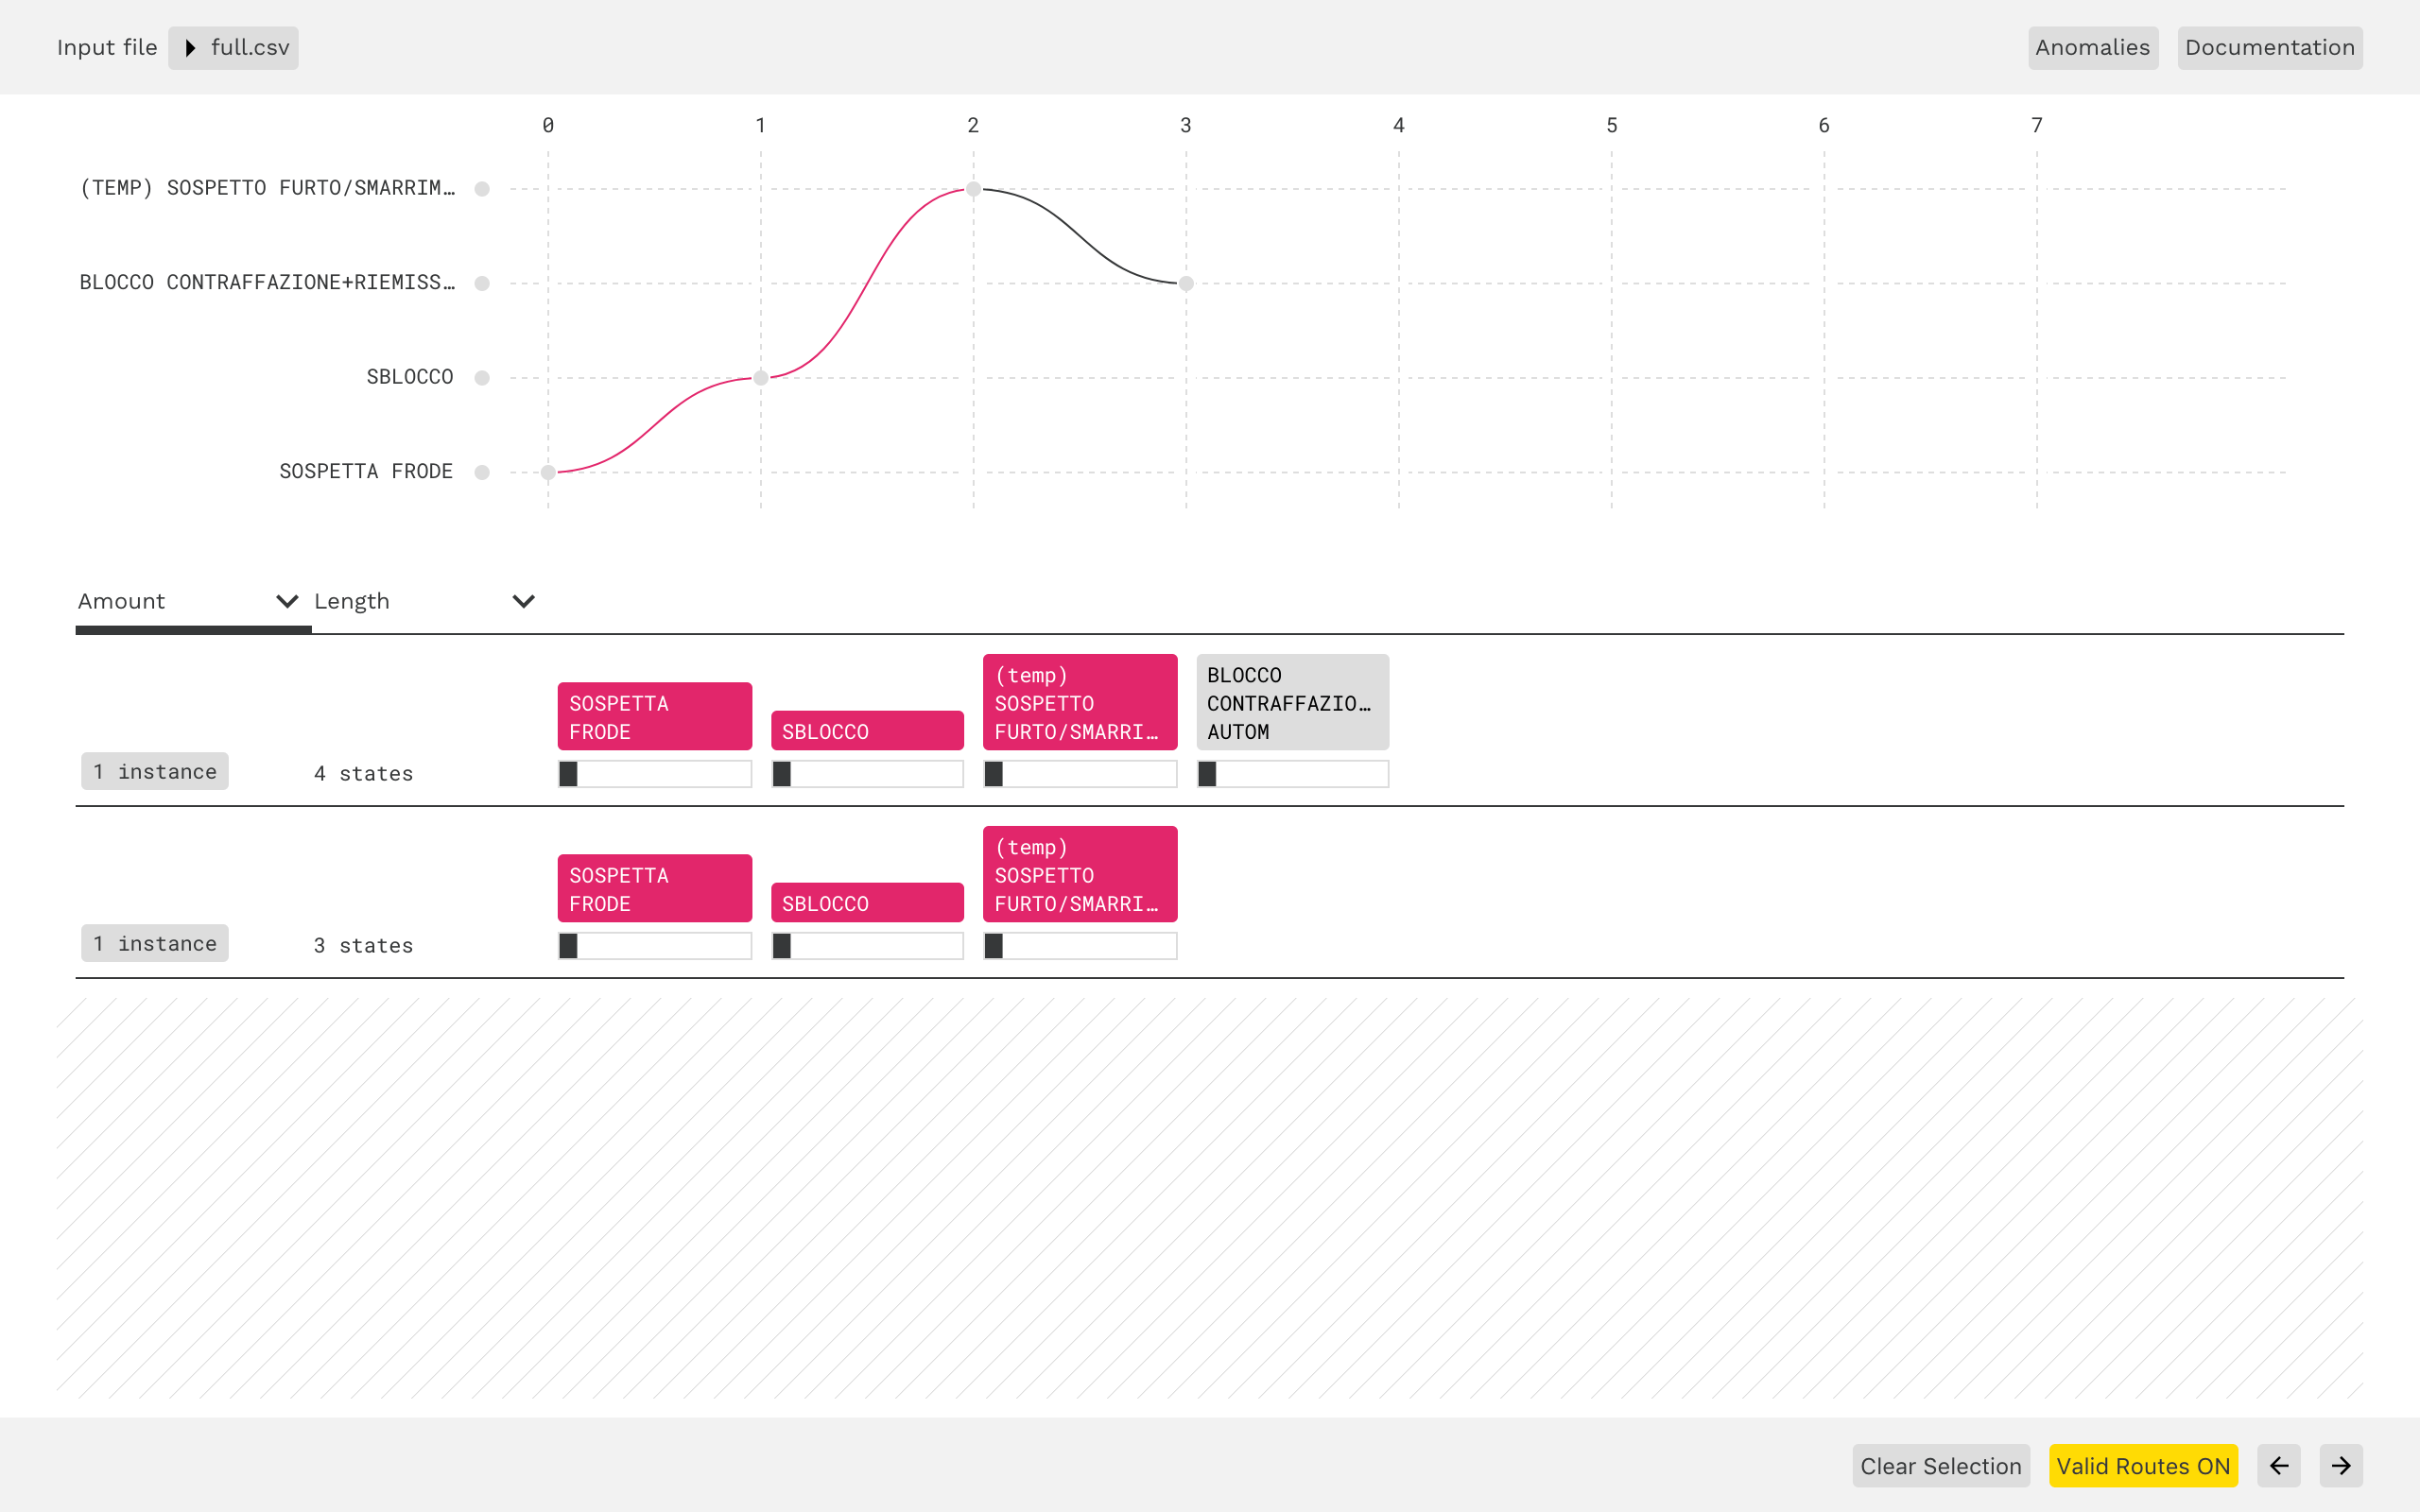
Find anomalous routes in the process, add new rules to the process once new anomalies are discovered, focus on relevant information filtering out previously accepted routes.
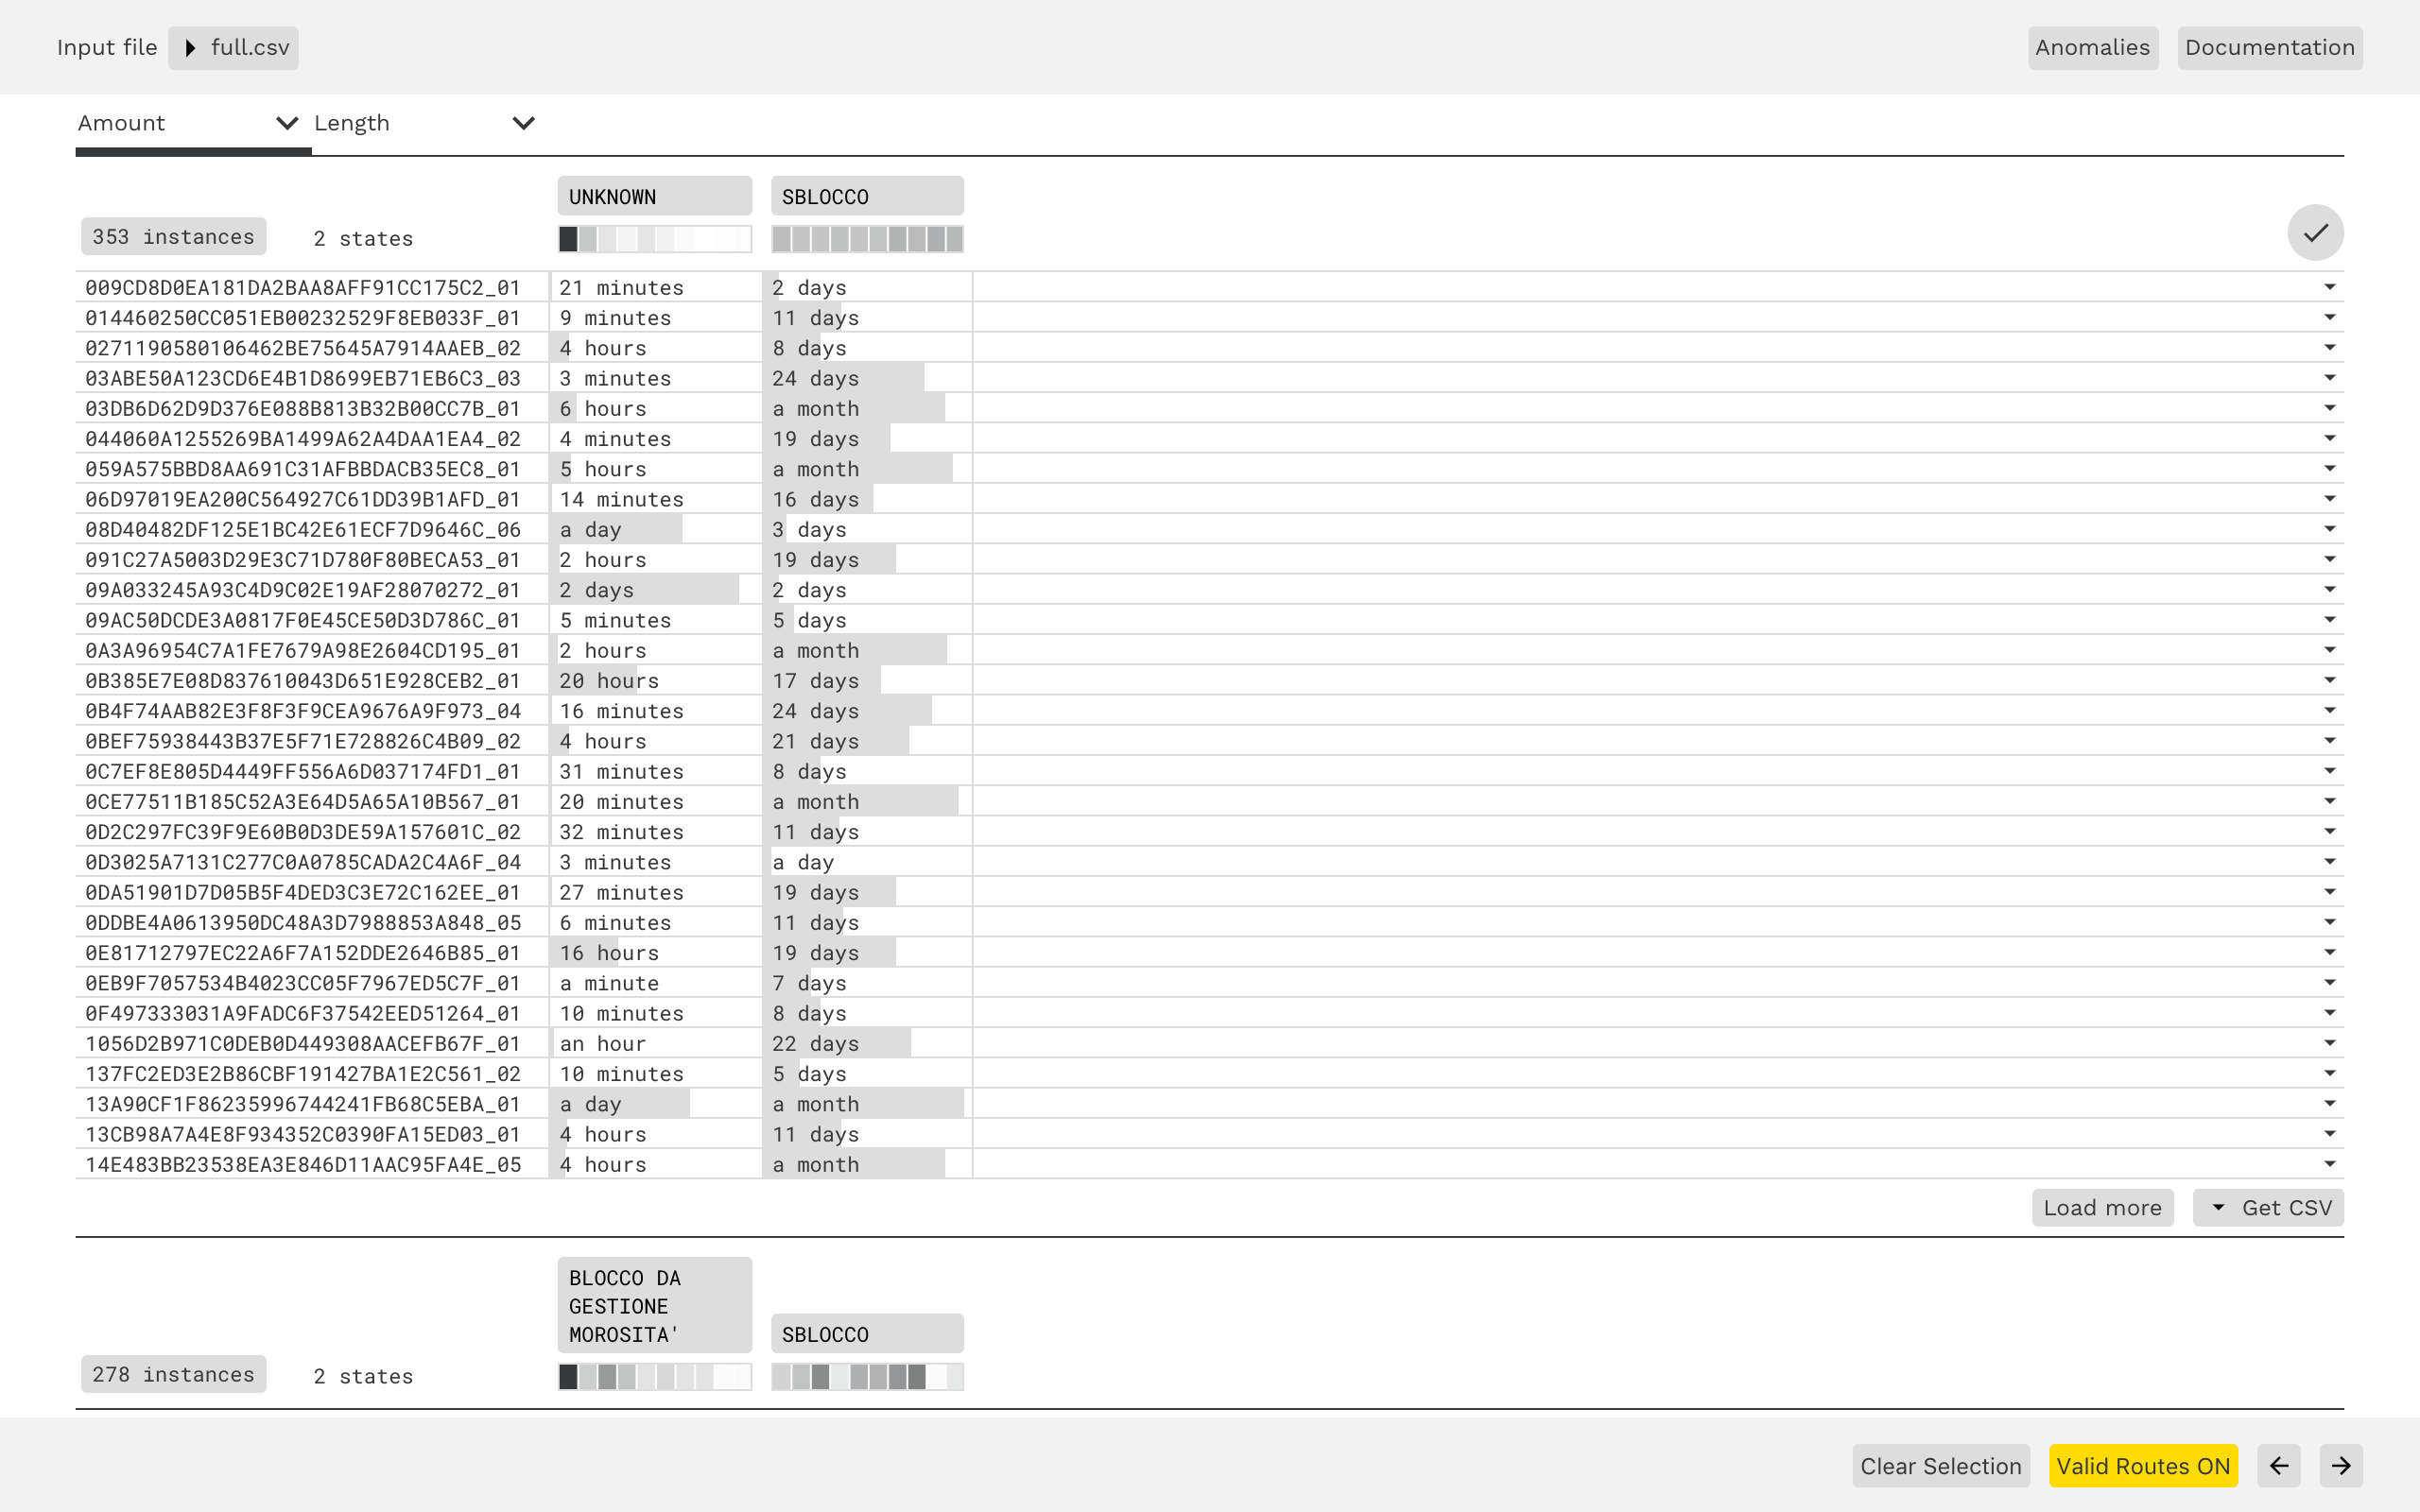
With Qbert you can explore all the routes followed by process entities, filter them by multiple states selection and visualize time durations of each process step. Moreover, you can define anomalous and valid routes, save these process rules for successive analysis or to create alerts.
Users need to track process rules on valid and anomalous routes, this will become a company asset for continuous improvement or for auditing purposes. With Qbert you can export process rules and reuse them under different scenarios.
Qbert is not tailored to a specific process, instead, it reads data from any process using CSV input files of a given format. With Qbert you can select a subset of process data and export it with the same input format.
Qbert abstracts and leverages the main features shared by all processes. While each process is unique, they share a set of common functionalities: each process can be described by entities that change state over time as actions occur.
| id | nodeId | nodeLabel | start | end |
|---|---|---|---|---|
| f34h67d | 144 | node A | 2017-01-20 9:32:49 | 2017-01-20 22:26:41 |
| y24f69x | 410 | node B | 2017-01-20 22:26:41 | 2017-01-21 19:03:00 |
| i32s66a | 65 | node C | 2017-01-16 11:32:06 | |
| y24f69x | 65 | node C | 2017-01-21 19:03:00 | 2017-01-23 09:13:24 |
| ... | ... | ... | ... | ... |
The input file is a comma-separated values delimited text file (CSV) with the comma as separator. Each line of the file describes the arrival of an entity in a state, from the whole information it is then possible to derive the complete journeys of the process entities. The table above shows an example of the expected columns in the CSV input file.
The project file stores information about anomalous segments and valid routes, it can be exported by an application instance and imported in another. Users can share anomalous segments and valid routes with colleagues by means of project files in JSON format.